
Scotland just increased its Minimum Unit Pricing from £0.50 to £0.65 per unit of alcohol. Within hours, global beverage alcohol companies recalculated SKUs, adjusted Gross-to-Net waterfalls, and validated compliance across markets. One policy change triggered a full-scale repricing exercise, and that’s the daily reality of alcohol pricing.
Every bottle that reaches a shelf passes through a Gross-to-Net framework:
Transfer Price → FOB/Invoice Price → Triple Net Price (NSV) → Price Support → A&P Spend → Brand Contribution.
Each step shapes profitability, compliance, and competitiveness across regions and channels.
However, the challenge lies in speed and scale. Your usual spreadsheets can’t keep up with evolving tax laws, fluctuating exchange rates, or region-specific price controls like MUP. Manual updates will multiply errors, delay approvals, and erode margins across your portfolio.
So, this guide will explain how pricing teams like yours can structure profitable, compliant alcohol prices using a value-chain backward approach and why leading beverage brands rely on Vistaar iPSM to automate global pricing governance and respond to market shifts in real time.
The Complexity of Global Alcohol Pricing
Beverage alcohol pricing operates within one of the most regulated commercial environments globally. Unlike standard consumer goods, alcohol prices must account for multiple layers of taxation, comply with jurisdiction-specific regulations, and adapt to diverse distribution models, all while maintaining profitability across markets.
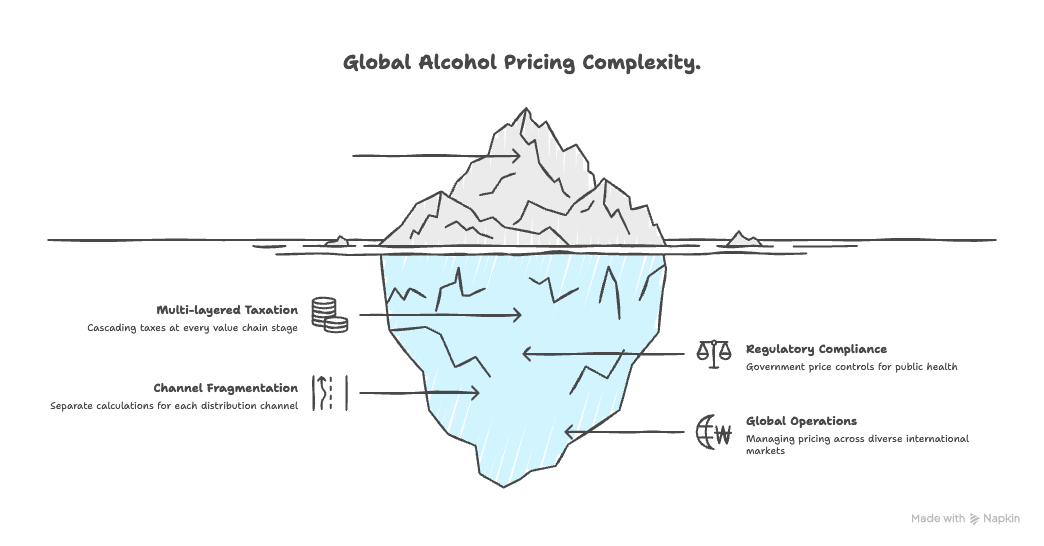
The four-layer tax framework that defines the complexity of global alcohol pricing, from excise and customs duties to VAT and state levies
Multi-layered taxation structures
Alcohol faces cascading taxes at every value chain stage. Excise applies at production or import, VAT/GST at retail, and customs duties at borders. In markets like India, state taxes can make a bottle cost two to three times what it would in a low-tax state. In the UK, excise depends on the alcohol strength; in the European Union, harmonization rules vary by country, with VAT rates ranging from 17% to 27%. The US combines state and federal duties, while emerging markets add import surcharges that can double prices. Even a minor rate adjustment can wipe out contribution margins or create compliance gaps.
Regulatory compliance requirements
Governments impose price controls to balance public health and market stability. Policies such as Scotland’s Minimum Unit Pricing (£0.65 per unit of alcohol) or Wales’ pricing framework are designed to curb excessive alcohol consumption and guarantee minimum tax collection. Similar structures exist in Canada, Australia, and parts of Eastern Europe.
These laws limit pricing flexibility and require constant Gross-to-Net recalibration to maintain compliance and contribution. Excise duties also vary by alcohol strength, packaging, and category, which means a premium spirit can sometimes yield lower contribution margins in high-duty markets even at higher retail prices.
Beyond taxation, label mandates, promotional restrictions, and advertising guidelines increase operational overhead. Each market approval cycle demands updated documentation and audit trails, making manual, spreadsheet-based pricing workflows unsustainable when regulatory changes occur simultaneously across regions.
Channel and market fragmentation
Each distribution channel requires separate gross-to-net calculations. For instance,
- On-trade (bars, restaurants) focuses on serving size, pour cost, and menu positioning.
- Off-trade (supermarkets, retail chains) revolves around volume, margin, and shelf competition.
- E-commerce layers in platform commissions, delivery logistics, and real-time discounting.
- Global travel retail operates on duty-free models, currency variability, and dynamic replenishment cycles.
A pricing decision made for one channel often creates competitive pressure or arbitrage risk in others. And when these flows aren’t centrally managed, it leads to margin dilution or grey-market leakage.
Global operational scope
Multinational beverage companies manage pricing across dozens of markets simultaneously, each with unique tax calendars, exchange rates, and inflation patterns. Even a 5% currency swing or duty adjustment can shift contribution margins overnight.
Compounding that are fragmented routes to market. Some countries rely on exclusive distributors, others on wholesalers or direct retail. You’re building separate price waterfalls for each to preserve global brand positioning without sacrificing local profitability.
Why can manual systems not scale?
Excel-based pricing creates thousands of disconnected spreadsheets by country, state, channel, and brand, each with its own tax logic and cost assumptions. This fragmentation creates inconsistent calculations, siloed knowledge, and loss of control over global pricing governance.
When tax rates change or new regulations take effect, pricing teams must manually update dozens of sheets across markets, increasing the likelihood of error and delaying approvals. Without a unified system, auditability suffers, and version control breaks down across time zones and departments.
This is exactly the kind of challenge modern pricing systems like Vistaar’s iPSM solve. By replacing scattered spreadsheets with a unified pricing governance model, global beverage leaders can maintain accuracy, consistency, and auditability across every market while reacting instantly to regulatory or tax changes.
Understanding Alcohol Pricing Principles
Effective alcohol pricing requires a structured approach to tracking value from production through final sale. Unlike standard consumer goods, beverage alcohol pricing accounts for regulatory constraints, multi-tiered distribution, and promotional programs that affect profitability.
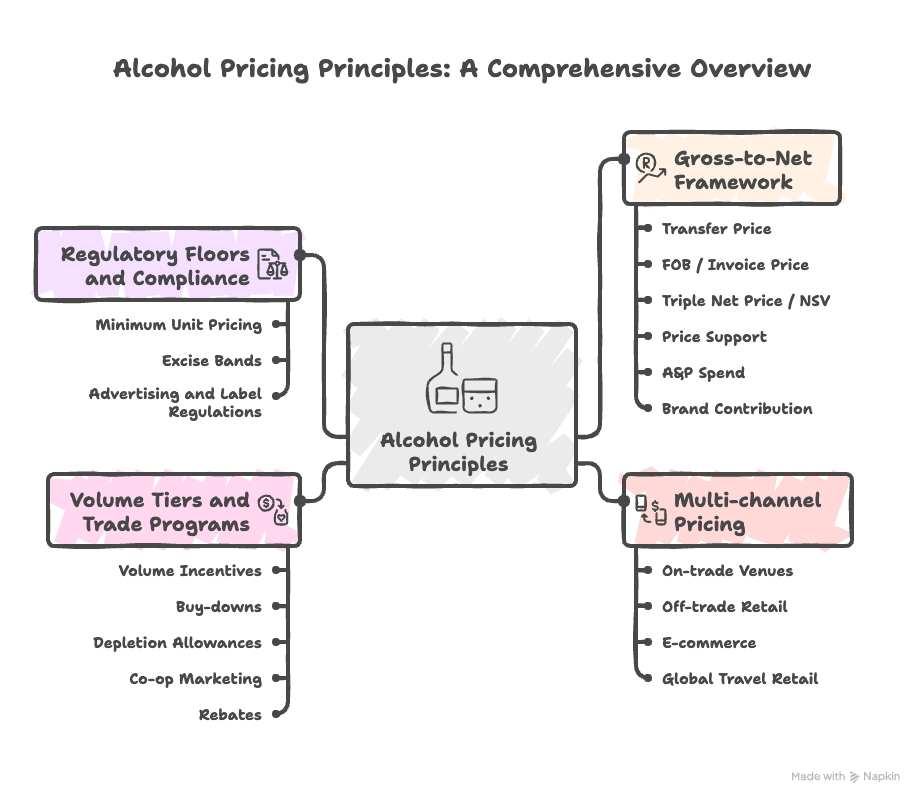
A visual overview of core alcohol pricing principles, showing how Gross-to-Net components, channel dynamics, and compliance layers shape brand profitability.
The foundation of that visibility is the Gross-to-Net framework.
The Gross-to-Net stack
The Gross-to-Net framework measures how revenue flows from initial production cost to final brand profitability. Each metric in this stack represents a decision point where pricing strategy, compliance requirements, and market dynamics intersect.
| Metric / Concept | Definition |
|---|---|
| Transfer Price | This is the baseline cost of moving a product from production to a commercial entity (internal or external). |
| FOB / Invoice Price | The price charged to the first external party (distributor, wholesaler, or retailer). |
| Triple Net Price / Net Sales Value (NSV) | Actual revenue received after subtracting all trade discounts, volume incentives, and contractual allowances. |
| Price Support | Mechanisms to temporarily reduce distributor/retailer cost: Buy-downs (immediate discount), Bill-backs (retrospective credits), and Depletion Allowances (reward for moving product to retail). |
| A&P Spend (Advertising & Promotional) | Investments in trade marketing, consumer promotions, POS materials, and co-op advertising. |
| Brand Contribution | This is the final profitability metric after all commercial costs (including A&P). |
Multi-channel pricing considerations
Each distribution channel operates with distinct pricing mechanics that affect gross-to-net calculations and profitability analysis.
| Sales Channel | Primary Structure |
|---|---|
| On-trade Venues | Consumption at Point of Sale (Bars, Restaurants, Hotels). Here, bartenders and servers primarily influence brand selection through cocktail recommendations, house pour assignments, and premium-tier positioning. |
| Off-trade Retail | Traditional Take-Home Sales (Supermarkets, Specialty Stores) |
| E-commerce | Direct-to-Consumer (DTC) |
| Global Travel Retail | Duty-Free / International Travel |
Volume tiers and trade programs
Beverage alcohol pricing relies on structured incentive programs that link discounts to volume, loyalty, and performance.
- Volume incentives reward higher purchase commitments. For example, an account buying 100 cases a month receives better pricing than one buying 10. These tiers drive volume growth but must preserve margin integrity
- Buy-downs reduce invoice prices at the point of sale to accelerate sell-in during launches or seasonal pushes
- Depletion allowances pay distributors for sell-through rather than purchases, improving inventory flow but requiring precise claim validation
- Co-op marketing shares promotional costs between producer and retailer for local advertising or displays, raising visibility but diluting net contribution without clear ROI
- Rebates provide retrospective payments tied to annual targets, smoothing pricing but adding administrative complexity
When aggregated, these trade programs can consume 20–30% of NSV, making disciplined governance essential.
Regulatory floors and compliance boundaries
Compliance defines the limits of pricing freedom.
- Minimum Unit Pricing (MUP) sets legal floors on alcohol pricing. For example, £0.65 per unit in Scotland, forcing brands to protect distributor and retailer margins without violating the law.
- Excise Bands based on ABV or pack size create profitability cliffs. Even small strength changes can shift a SKU into a higher tax tier.
Advertising and Label Regulations add another layer of control, with mandatory documentation for every promotion or price change.
Manual systems struggle to track shifting MUP rates and excise bands across jurisdictions. But visibility alone isn’t enough. You still need a way to design prices that protect contributions while staying compliant. That begins with building prices backward from the consumer, not forward from cost.
How to Set Alcohol Prices (Value-Chain Backward Approach)
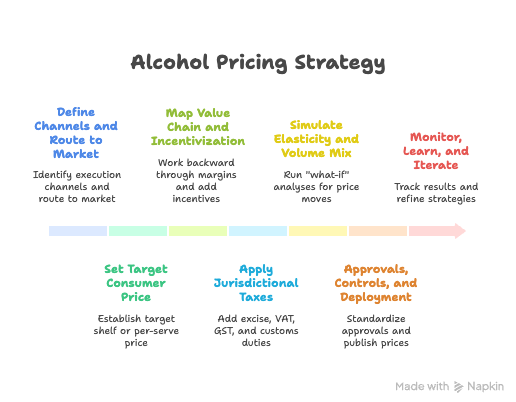
A diagram illustrating how pricing teams reverse-engineer from target consumer price to transfer price across taxes, margins, and incentives.
A value-chain backward model helps pricing teams work from the target consumer price (TCP) down to the transfer price. Here’s how you can apply it to set optimal alcohol prices:
Step 1: Define channels and route to market
Identify execution channels (on-trade, off-trade, e-commerce, and global travel retail) and determine the route to market (direct, distributor, or wholesaler). This step would establish the commercial structure and your entire pricing model will rest.
Step 2: Set the target consumer price (TCP)
Establish target shelf price (off-trade) or per-serve price (on-trade) by brand segment and positioning. Factor in competitive benchmarks, regulatory floors like MUP, and price ladders by SKU or format.
Step 3: Map the value chain and incentivization
From TCP, work backward through retailer margin, distributor margin, logistics, duties, and taxes. Next, layer in Price Support programs such as:
- Buy-downs (instant price reductions)
- Bill-backs (post-sale credits)
- Depletion allowances (rewards for sell-through)
- Rebates and A&P Spend are tied to promotional activity or account performance
Together, these elements define the Net Sales Value (NSV) and, ultimately, Brand Contribution, the most accurate reflection of profitability.
Step 4: Apply jurisdictional taxes and compliance
Add excise, VAT, GST, and customs duties by state or country. Validate that each market’s pricing waterfall meets local regulations and preserves margins.
Step 5: Simulate elasticity and volume mix
Run “what-if” analyses for price moves, promotional depth, and incentives by channel or account type. Measure projected demand shifts, net revenue, and contribution impact.
Step 6: Approvals, controls, and deployment
Standardize pricing approvals and apply guardrails for minimum margin and outlier detection. Publish approved prices and trade terms to field teams and partners with version control.
Step 7: Monitor, learn, and iterate
Track sell-in, depletions, and sell-out results against targets and competitors. Refine incentives, promotions, and Gross-to-Net assumptions based on real-time performance data.
You can build a perfect pricing model, but without automation, it will collapse under its own complexity and that’s exactly what the next section is about.
How Leading Beverage Brands Scale Pricing Without Losing Control?
Leading brands are replacing manual processes with automated pricing platforms that deliver the scale, consistency, and agility spreadsheets can’t match. These tools enable pricing teams to:
- Manage hundreds of jurisdictions and SKUs within a single system
- Maintain accurate margins and ensure regulatory compliance across every channel
- React instantly to duty changes, tax updates, or new pricing rules
Introducing iPSM (International Price Structure Management)
Vistaar’s iPSM platform automates end-to-end beverage alcohol pricing from cost of goods through retail shelf and on-premise service.
- It standardizes approval workflows and embeds market-specific tax logic, ensuring compliance with excise structures, VAT rates, and MUP regulations across all jurisdictions.
- Pricing teams can apply bulk updates when duties, excise rates, or MUP thresholds change, updating hundreds of SKUs simultaneously instead of editing individual spreadsheets.
- iPSM integrates elasticity modeling and volume planning into pricing decisions, enabling teams to simulate profitability scenarios and optimize brand contribution before implementation.
Indicative impact benchmarks from beverage alcohol implementations:
- Revenue improvement: typically 2–4%
- Profitability gain: typically 1–3%
- Operational workload reduction: 30–50% (approx.)
How Automation Enables Compliance, Auditability, and Forecasting Accuracy?
Beverage alcohol companies face constant regulatory pressure. Excise duties are adjusted quarterly in some markets, MUP thresholds are increased to reflect inflation targets, and VAT rates change with government policy shifts. Each change creates cascading effects across pricing structures, distribution economics, and brand profitability.
Manual pricing systems cannot respond at the required speed or accuracy. Automated pricing platforms solve this through built-in scenario planning capabilities that model regulatory changes before they take effect.
Pricing teams simulate regulatory scenarios in advance: “If Excise increases 5% in Market X, how does that affect brand contribution across our portfolio?” or “If Scotland’s MUP moves from £0.50 to £0.65, which SKUs fall below the floor and require price increases?” The platform instantly calculates cascading effects across the Gross-to-Net stack, showing the impact on NSV, required retail price adjustments, and margin preservation strategies for all affected SKUs.
Once scenarios are validated, role-based approval workflows route pricing changes to appropriate stakeholders. Market managers confirm local accuracy and competitive implications. Regional directors verify cross-market consistency and alignment with brand positioning. Finance teams validate margin thresholds and profitability targets. Automated compliance checks flag issues before approval, say, prices below MUP floors, margins outside acceptable ranges, or excise calculations that fail validation rules. Every pricing decision generates a complete audit trail.
How Automated Alcohol Pricing Tools Measure Pricing Performance and Profitability
Modern beverage pricing is about continuously measuring whether those numbers deliver real business impact. In this regard, automated pricing tools help pricing teams connect analytics, elasticity insights, and benchmarking into one dynamic system of control.
Linking analytics and elasticity modeling to revenue
Automation platforms translate pricing decisions into measurable financial outcomes. By using elasticity modeling, pricing teams can understand how every price move affects revenue and brand contribution across on-trade, off-trade, and e-commerce. They reveal patterns like how a 2% price hike in a premium SKU could shift volume toward mid-tier offerings, or how promotional depth changes incremental versus baseline volume. These insights turn “what-if” tests into quantifiable margin and volume projections, replacing intuition with precision.
Benchmarking at global scale
Manual benchmarking makes it nearly impossible for you to keep up with multi-market complexity. With automation, you can centralize all your performance data and run consistent cross-market, cross-channel comparisons in one place. Also, you can instantly see how your pricing, promotions, and A&P spend stack up against other markets and competitors, revealing your strongest regions and where inefficiencies hide. This kind of global visibility helps you adapt your pricing playbooks faster and safeguard market share without losing compliance or brand consistency.
Unified visibility for smarter decisions
An integrated pricing ecosystem lets you bring together your Gross-to-Net data, rebates, and trade investments under one digital framework. When you correlate these levers in real time, you can see how every pricing action ripples through profitability, ensuring that each tactical move you make directly supports your long-term growth goals.
Why Managing Alcohol Pricing with Vistaar Matters
Vistaar’s iPSM platform serves leading beverage alcohol brands globally, drawing on deep domain expertise built over 15+ years of category-specific implementations.
Vistaar’s edge in beverage alcohol:
- Powers pricing for a significant share of premium spirits in the U.S. through platform licensing
- Trusted by leading wines and spirits brands across APAC, Europe, the UK, LATAM, the Americas, Africa, and global travel retail
- Embeds 15+ years of alcohol-specific pricing logic, compliance frameworks, and regulatory requirements directly into platform functionality
Proven impact:
- Revenue improvement: 2–4%
- Operational workload reduction: 30–50%
- Faster time-to-market for pricing changes and regulatory responses
Competitive differentiation:
- Enterprise-grade configurability versus rigid niche tools that cannot adapt to complex, multi-market requirements
- Excel replacement at scale for 150+ global customers managing millions of SKUs across regulated industries
You’ve already seen how automation transforms compliance and profitability.
Now, take the next step.
Learn how Vistaar’s iPSM platform can help you achieve that precision at global scale.
Frequently Asked Questions (FAQs)
How can global beverage brands stay profitable while adapting to changing excise laws and MUP regulations?
Automated pricing platforms model regulatory changes in real time, recalculating Gross-to-Net impact across SKUs within minutes to maintain compliance and margins. This replaces manual spreadsheets that risk errors and missed deadlines.
What’s the best way to balance on-trade and off-trade pricing strategies?
Create separate Gross-to-Net models for each channel. On-trade prioritizes per-serve profitability, while off-trade focuses on shelf pricing and promotions. Coordinated governance prevents cross-channel price conflicts.
How can scenario planning help predict the impact of tax or demand shifts on profitability?
Scenario tools simulate “what-if” scenarios, such as excise hikes or MUP changes, showing immediate effects on NSV, brand contribution, and retail price. Teams can act proactively rather than react after a marginal loss.
When should alcohol producers move from Excel to an automated pricing platform?
Transition when multi-market, multi-channel pricing becomes too complex for spreadsheets, typically due to manual updates that cause approval delays, compliance risks, or lost visibility. Automation restores speed and control.
What key metrics should pricing teams track to measure pricing performance and ROI?
Monitor Gross-to-Net components (NSV, brand contribution), price elasticity, and promotional lift versus baseline volume. Dashboards linking these metrics to outcomes reveal margin erosion early and validate ROI.