
.png)
TL;DR
- PBM contracts control pharmacy reimbursement through Generic Effective Rate provisions, Maximum Allowable Cost lists, and retroactive DIR fees that increased 107,400% since 2010
- Pharmacies struggle with U&C pricing because "lesser of" clauses, spread pricing, and clawbacks create unpredictable revenue settled months after transactions
- 83% of pharmacists face clawbacks 10+ times monthly, while 67% receive no information on DIR fee timing or amounts
- Pricing engine intelligence automates U&C optimization by modeling GER impact, patient volume, and competitive positioning across thousands of drugs simultaneously
- Real-time adjustments and predictive analytics transform reactive reconciliation into a proactive strategy with measurable margin outcomes
Retail pharmacies face a financial paradox. U.S. prescription drug expenditures reached $805.9 billion in 2024, up 10.2% from the previous year, yet many pharmacies dispense medications at a loss.
Here, the culprit is Pharmacy Benefit Manager contracts with Generic Effective Rate provisions that retroactively reduce payments months after prescriptions are filled.
In fact, 83% of pharmacists report clawbacks at least 10 times monthly, while DIR fees surged 107,400% between 2010 and 2020. Managing Usual and Customary pricing becomes a high-stakes calculation. Take, for instance, all the hassles of balancing consumer attraction, PBM reimbursements, and GER thresholds across thousands of drugs and hundreds of stores.
However, pricing engine intelligence automates this complexity, revealing the true relationship between U&C prices and effective revenue to optimize profitability while maintaining compliance.
In this guide, let’s explore how it can help retailers deal with PBM contracts and reimbursement models.
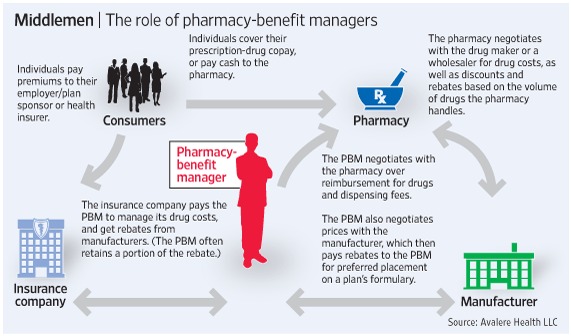
How PBM Contracts and Reimbursement Models Actually Work
Pharmacy Benefit Managers function as intermediaries between insurance companies, pharmacies, and pharmaceutical manufacturers. They negotiate drug prices, create formulas, and process prescription claims electronically. Currently, the top three PBMs process roughly 80% of all prescriptions in the country, giving them substantial power to dictate contract terms that determine actual pharmacy revenue.
Reimbursement models within these contracts directly affect profitability:
- Fee-for-service pays pharmacies separately for each dispensing act, providing transparency but no guaranteed baseline
- Capitation pays a fixed monthly amount per enrolled patient regardless of prescription volume, stabilizing revenue but transferring utilization risk to the pharmacy
- Bundled payments combine multiple services into a single reimbursement, common in specialty pharmacy, where clinical support accompanies expensive medications
Additionally, Maximum Allowable Cost lists establish price ceilings for generic drugs, but PBMs consider MAC pricing formulas trade secrets and are not required to disclose how these costs are determined. The Generic Effective Rate amplifies unpredictability by measuring a contracted percentage discount from the Average Wholesale Price across all generic dispensing over a defined period. If aggregate payments result in an 18% discount from AWP, but the contract stipulates a 20% discount, the PBM assesses a clawback to reach the contracted rate.
The Usual and Customary price directly influences final reimbursement through "lesser of" clauses. If a pharmacy sets U&C at $25 to remain competitive, but the PBM's MAC plus dispensing fee would have paid $30, reimbursement drops to $25.
Copay clawbacks add further complexity. When a patient's copay exceeds the pharmacy's cost for the medication, the PBM recoups the excess amount from the pharmacy. These contract mechanisms create substantial variance between point-of-sale revenue and final settlement, leaving pharmacies unable to model reimbursement outcomes before making pricing decisions.
Why PBM Reimbursement Breaks in Practice
Pharmacy pricing teams confront operational obstacles that extend beyond contract interpretation into daily execution. The core issue is not complexity itself but the inability to measure true profitability until months after pricing decisions are made.
Hidden Fees and Retroactive Adjustments
67% of pharmacists receive no information on how much and when DIR fees will be assessed, making margin forecasting impossible. Initial point-of-sale reimbursement appears profitable, but fees assessed three to six months later convert those same prescriptions into net losses.
DIR fees increased by 107,400% from 2010 to 2020, transforming from minor adjustments into primary drivers of financial distress. The opacity prevents pharmacies from making informed pricing decisions because the final settlement amount remains unknown until long after the transaction.
Spread Pricing and Revenue Opacity
PBMs charge health plans one amount while reimbursing pharmacies less, pocketing the difference as profit with zero visibility to the pharmacy. For instance, Ohio found that PBMs pocketed $224.8 million through spread pricing alone in one year of their Medicaid program.
Pharmacies see only their reimbursement rate and have no access to what the PBM charges the payer, eliminating any ability to negotiate based on actual transaction economics. This lack of transparency makes it impossible to assess whether contracted rates reflect fair market value or are simply designed to maximize PBM margin.
Clawback Unpredictability
A pharmacy dispenses a prescription for $10 gross profit, then sees a $12 DIR fee clawed back months later, resulting in a $2 net loss on that transaction. Performance-based assessments use unclear calculation methodologies applied retroactively, often comparing retail and specialty pharmacies on identical metrics despite vastly different service models.
Network-wide GER reconciliations create liability based on aggregate performance beyond individual pharmacy control, where strong margin management at one location cannot offset poor network performance elsewhere.
U&C Pricing Complexity
Pricing managers overseeing 300 stores and 5,000 SKUs must model how cash price changes affect GER reconciliation, patient volume, competitive positioning, and compliance simultaneously. Spreadsheets cannot handle multi-variable optimization at this scale, and manual analysis takes weeks while market conditions shift and competitor pricing changes.
Without data transparency and automated scenario modeling, pricing decisions become educated guesses rather than strategic choices grounded in actual reimbursement outcomes.
What Pharmacy Pricing Teams Actually Need (Before Tools)
Pricing engine automation establishes the operational infrastructure, but extracting maximum value from PBM contracts requires analytical depth. Data analytics transforms raw prescription data into actionable insights about pricing performance, patient behavior, and reimbursement trends.
Here’s how:
Pricing Performance Tracking Across Multiple Dimensions
Analytics monitors U&C pricing performance against reimbursement outcomes across drug categories, store locations, and payer contracts. High-velocity generics require different price optimization than specialty medications, and the system identifies these patterns at scale.
Different stores performing under identical pricing strategies reveal location-specific factors like local competition or patient demographics that warrant customized approaches instead of network-wide uniformity.
Patient Adoption and Reimbursement Trend Analysis
When cash prices change, prescription abandonment rates, brand-to-generic substitution patterns, and price sensitivity shifts become measurable.
Reimbursement trend analysis detects MAC price erosion before monthly reconciliations, flagging drugs where reimbursement declines faster than purchase costs. As a result, pricing managers can make informed U&C adjustments that maintain patient access while protecting margin, rather than discovering compression after quarterly financial reviews.
Predictive Analytics for Margin Forecasting
Historical GER reconciliations, seasonal volume patterns, and competitive pricing movements feed predictive models that anticipate future performance. The system forecasts margin outcomes three to six months ahead, accounting for expected DIR fees and clawback liability.
Subsequently, budgeting transforms from historical extrapolation into a data-driven projection that accounts for the lag between point-of-sale revenue and final settlement.
Cross-Industry ROI Evidence
Retailers that have implemented data-driven dynamic pricing have seen 2–5% sales growth and 5–10% margin improvement in pilot categories, according to McKinsey. These outcomes come from improved pricing consistency, better elasticity modeling, and faster competitive response.
Pharmacy retail faces comparable analytical challenges with:
- Product portfolios
- Location networks
- Regulatory compliance requirements
These can benefit from automated, data-driven optimization.
How Pricing Engine Intelligence Streamlines and Maximizes PBM Reimbursement
Pricing engine intelligence transforms reimbursement management from reactive reconciliation to proactive optimization. The technology automates complex calculations that manual systems cannot handle at an enterprise scale.
Automated U&C Optimization Through Unified Data
Vistaar's Retail Price Optimization platform consolidates contract terms, GER thresholds, MAC lists, and historical transaction data into a unified analytical layer. The system calculates optimal cash prices across thousands of drugs and hundreds of locations by modeling how U&C changes affect final settlement before prices reach the market.
Rather than managing disconnected spreadsheets that cannot account for retroactive adjustments, pricing teams work from a single source that eliminates version control issues and manual errors. This unified workflow is enabled by Vistaar’s SmartPricing engine, which models reimbursement outcomes in real time to support more precise U&C decisions.
Multi-Attribute Scenario Modeling
The platform factors drug category, patient demographics, store location, competitive pricing, and PBM contract performance simultaneously to identify optimal price points.
For example, a pricing manager can test scenarios where U&C prices decrease 5% on high-volume generics to increase market share while maintaining margin through optimized pricing on specialty drugs with less price sensitivity.
The system also calculates expected GER impact, projected patient volume changes, and margin outcomes for each scenario, transforming pricing decisions from educated guesses into data-driven strategies with predictable outcomes.
Real-Time Dynamic Adjustments
When a PBM updates MAC pricing mid-week, the platform recalculates optimal U&C prices across affected drugs and flags opportunities where reimbursement increases create room for competitive cash price reductions.
Automated alerts identify prescription volume trends in specific therapeutic categories and determine whether price adjustments can capture additional market share without triggering unfavorable GER reconciliations.
These real-time capabilities compress pricing cycle times from weeks to days, allowing pharmacies to respond to market conditions while competitors remain locked into outdated price lists.
Isolated Pricing Impact Measurement
The platform separates pricing effects from other variables, such as patient behavior, seasonal demand fluctuations, and formulary changes, which also influence revenue. This attribution clarity allows pricing teams to demonstrate ROI from pricing strategy changes and make informed decisions about which drugs warrant aggressive pricing versus which should prioritize margin protection.
Pricing decisions become backed by measurable outcomes rather than assumptions about how contract terms will settle months in the future.
Pricing Strategies That Improve Outcomes Under PBM Contracts and Reimbursement Models
Portfolio segmentation recognizes that different drug categories serve different strategic purposes. Here are the key strategies for optimizing U&C pricing across your pharmacy network:
Demographic-Driven Pricing Objectives
Patient demographics determine price sensitivity and prescription behavior in measurable ways. As a case in point, women aged 25-55 represent a demographic segment with high prescription utilization for contraceptives, prenatal vitamins, and chronic condition management, but they also demonstrate strong price awareness and willingness to compare cash options across pharmacies.
Setting volume objectives for drugs primarily dispensed to this demographic captures market share, while drugs targeting older Medicare populations with supplemental coverage warrant margin objectives since reimbursement matters more than cash price competitiveness.
Market Checks and Competitive Intelligence
Local competitive pricing data provides essential context for U&C decisions that spreadsheets cannot incorporate. A pharmacy in a suburban area with three competitors within two miles needs different cash pricing than a rural location with limited alternatives.
Market checks identify which drugs competitors use as loss leaders to attract traffic versus which they price for margin, informing decisions about where to match, undercut, or maintain premium positioning.
Price Science Models for Long-Term Impact
Testing price changes through controlled experiments reveals actual patient behavior rather than assumed elasticity. Simply put, a 10% reduction in U&C price for common antibiotics might increase prescription volume by 15%, but only price science models can determine whether the margin trade-off improves total profitability after accounting for GER reconciliation effects.
These models assess how pricing strategies affect market share growth, patient retention rates, and competitive positioning over 12-18 month periods, providing evidence for strategic decisions that balance short-term revenue with long-term market position.
Start Optimizing Your U&C Pricing with Vistaar
PBM contract complexity will persist, but pharmacy pricing teams no longer need to rely on spreadsheets or retrospective reconciliation. Vistaar provides the intelligence, automation, and real-time visibility needed to manage reimbursement risk proactively rather than reactively.
Vistaar’s pricing optimization platform transforms U&C pricing by delivering:
Predictive accuracy for reimbursement outcomes
SmartPricing models GER impact, DIR fee exposure, and MAC volatility before prices go live, eliminating guesswork and improving forecast reliability.
Real-time responsiveness to PBM and market changes
Automated recalculation updates U&C prices instantly when MAC lists shift or competitive pricing changes, enabling faster decisions and stronger market positioning.
Multi-attribute optimization at enterprise scale
The platform evaluates drug category, store location, patient demographics, and payer behavior simultaneously, something manual systems cannot achieve.
Clear ROI attribution for every pricing decision
Isolated impact measurement shows how each price change influences reimbursement, margin, and volume, giving teams confidence in strategic adjustments.
A unified data foundation for compliance and consistency
Vistaar consolidates PBM contracts, GER terms, MAC lists, and historical transactions into one trusted system of record, reducing errors and ensuring compliance.
Retail pharmacies operating under PBM contracts require precision, not guesswork. Vistaar's pricing optimization platform provides the analytical foundation to manage U&C pricing strategically while maintaining compliance and competitive positioning across all payment channels.
To learn more, contact us.
Frequently Asked Questions
What are the four main methods of reimbursement?
The four main reimbursement methods are fee-for-service (paying separately for each service provided), capitation (fixed monthly payment per patient regardless of services), bundled payments (single payment covering multiple related services), and cost-based reimbursement (payment calculated from actual costs incurred). Each method affects pharmacy profitability differently depending on prescription volume, patient mix, and operational efficiency.
What is the reimbursement model?
A reimbursement model defines how payers compensate pharmacies for prescription services, establishing the formula for calculating payment amounts, timing of settlements, and conditions for adjustments or clawbacks. The model includes pricing structures like Maximum Allowable Cost lists, Generic Effective Rate thresholds, and performance metrics that determine final payment after reconciliation.
What are PBM contracts?
PBM contracts are agreements between Pharmacy Benefit Managers and pharmacies that establish reimbursement rates, network participation terms, and performance requirements. These contracts dictate how much pharmacies receive for prescriptions covered by insurance plans, including provisions for retroactive adjustments, DIR fees, and spread pricing arrangements.
How long are PBM contracts?
PBM contracts typically run for one to three years, with annual reconciliation periods for Generic Effective Rate calculations and performance-based adjustments. Contract length varies by network size and negotiating leverage, with larger pharmacy chains often securing longer terms while independent pharmacies may face shorter renewal cycles.

As an experienced pricing solutions partner to some of the biggest names in global business, Vistaar offers a range of services to help our customers reach their maximum potential. Talk to us to see how we can help you create a more profitable future.
.png)