



Key Takeaways
- Contribution margin equals net revenue minus variable costs, and dividing it by net revenue gives the contribution margin ratio
- A $200 product with $120 of variable cost earns $80 of contribution per unit, a 40% ratio
- B2B variable costs include freight and sales commissions, which is why contribution margin usually sits below gross margin
- At a 40% contribution margin ratio, a 10% discount needs about 33% more volume just to hold total contribution flat
- Deal approval floors and capacity tiebreakers are where contribution margin earns its keep
To calculate contribution margin, subtract variable costs from net revenue. Per unit, that means selling price minus variable cost per unit, and dividing the result by the selling price gives the contribution margin ratio.
The formula fits on one line, while the inputs take judgment. A B2B order carries freight terms and rebate accruals that a textbook example leaves out, and each one changes the answer a pricing team uses to approve a deal.
This guide walks through the formulas and a copyable calculator, then the pricing decisions where the number matters most.
The Contribution Margin Formulas
The calculation comes in three forms, and each answers a slightly different question. All three use the same inputs, so one dataset covers every version.
The per-unit figure tells you what each sale adds toward fixed costs and profit. The ratio makes products with very different price points comparable, and it feeds directly into break-even analysis.
How to Calculate Contribution Margin Step by Step
A reliable calculation follows five steps, and the first two decide whether the answer holds up in a pricing review.
- Start from net revenue: Take the invoiced price after on-invoice discounts, since list price overstates what the customer pays
- List every variable cost: Include each cost that rises or falls with one more unit sold, such as materials and outbound freight
- Classify the gray areas: Decide how to treat semi-variable costs like energy or warehouse labor, then apply that choice consistently
- Subtract variable costs from net revenue: The result is contribution margin per unit or in total
- Divide by net revenue: The result is the contribution margin ratio
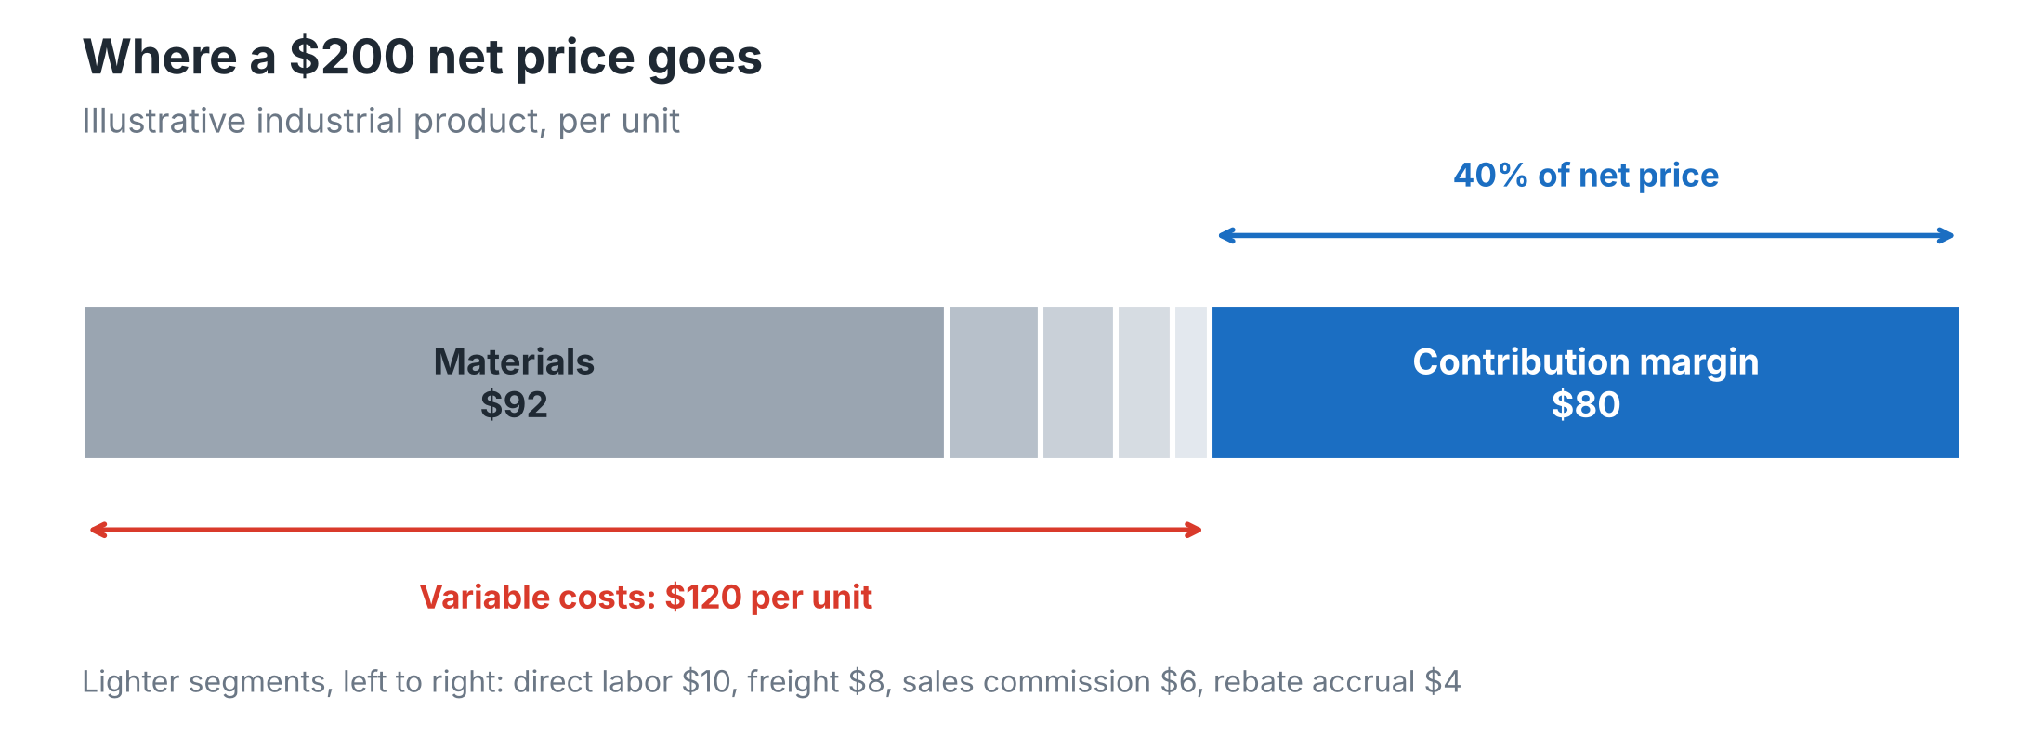
Worked calculator for a B2B order
The table below works through a 500-unit order for an industrial product. Copy the structure, replace the example figures with your own in the last column, and the formulas carry through.
The rebate appears here as a variable cost. Some teams subtract rebates from revenue instead, which works equally well as long as the rebate shows up in only one of the two places.
Vistaar's contribution margin glossary entry covers the definition in brief, and this calculator extends it to a full order.
Setting up the calculator in a spreadsheet
The same layout works in Excel or Google Sheets with four formulas. Put net revenue per unit in cell C4 and the five variable cost lines in C5 through C9.
- Total variable costs: In C10, enter =SUM(C5:C9)
- Contribution margin per unit: In C11, enter =C4-C10
- Ratio: In C12, enter =C11/C4 and format the cell as a percentage
- Order total: In D11, multiply the per-unit margin by the order quantity, for example =C11*500
Commission and rebate lines work best as formulas tied to C4, such as =C4*3%, so they update automatically whenever the net price changes.
From Contribution Margin to Break-Even Volume
Once fixed costs enter the picture, the same number answers a planning question about volume. Break-even volume equals fixed costs divided by contribution margin per unit.
A product line carrying $1.2 million of fixed costs needs 15,000 units at $80 of contribution each to break even. Every unit beyond that adds $80 to operating income, which the contribution-format statement below makes visible.
Break-even moves quickly with price. A $10 price cut on the same line, with variable costs held steady, lowers contribution to $70 per unit and lifts break-even to about 17,143 units.
Laid out this way, the statement separates the costs that pricing and deal terms influence from the costs set by capacity decisions. A traditional income statement blends the two inside cost of goods sold.
Which Costs Count as Variable in a B2B Business
The calculation lives or dies on cost classification. A cost belongs in contribution margin when it moves with each unit or order, the same test the OpenStax managerial accounting text applies, and the table below sorts the common B2B lines.
Direct labor causes the most debate in manufacturing. A shift crew paid the same wage whether the line runs at 70% or 90% of capacity behaves like a fixed cost over a quarter, so it belongs outside contribution margin for short-term pricing decisions.
Freight terms deserve the same scrutiny. Under delivered pricing the seller carries freight, while under ex-works terms the buyer does, and a landed cost view keeps those differences visible order by order. On a heavy product shipped 800 miles, that difference can exceed the entire on-invoice discount.
Contribution Margin Ratio vs. Gross Margin
The contribution figure usually sits below gross margin because it captures selling costs that gross margin leaves out. In the worked example, cost of goods sold covers materials and direct labor at $102 per unit, which puts gross margin at 49%.
On the same product, contribution comes to 40%, since freight and sales-related costs come out as well. That nine-point difference is the part of profitability that pricing and deal terms control most directly.
Gross margin stays the right figure for financial reporting. For a quote or a discount request, contribution margin gives the clearer read on whether the deal pays for itself.
What Happens to Contribution Margin When Costs Rise
Input costs are moving again, and manufacturers in the latest NAM outlook survey expect them to rise 5.8% over the next 12 months. Applied to the worked example, a 5.8% materials increase lifts the $92 line to $97.34.
At an unchanged $200 price, contribution per unit falls to $74.66 and the ratio slips to 37.3%. Restoring the $80 of contribution takes a price of about $205.62, a 2.8% increase, while restoring the 40% ratio takes about $209.71.
The two targets lead to different conversations with customers. The pricing team should decide which one it is defending before the increase letter goes out.
Using Contribution Margin for Pricing Decisions
Once the number is calculated, it becomes a decision tool. Pricing teams get the most out of it in four decisions.
Discount break-even
A discount removes contribution on every unit, so volume has to rise to make up the difference. The required volume increase equals the discount divided by the contribution margin ratio minus the discount.
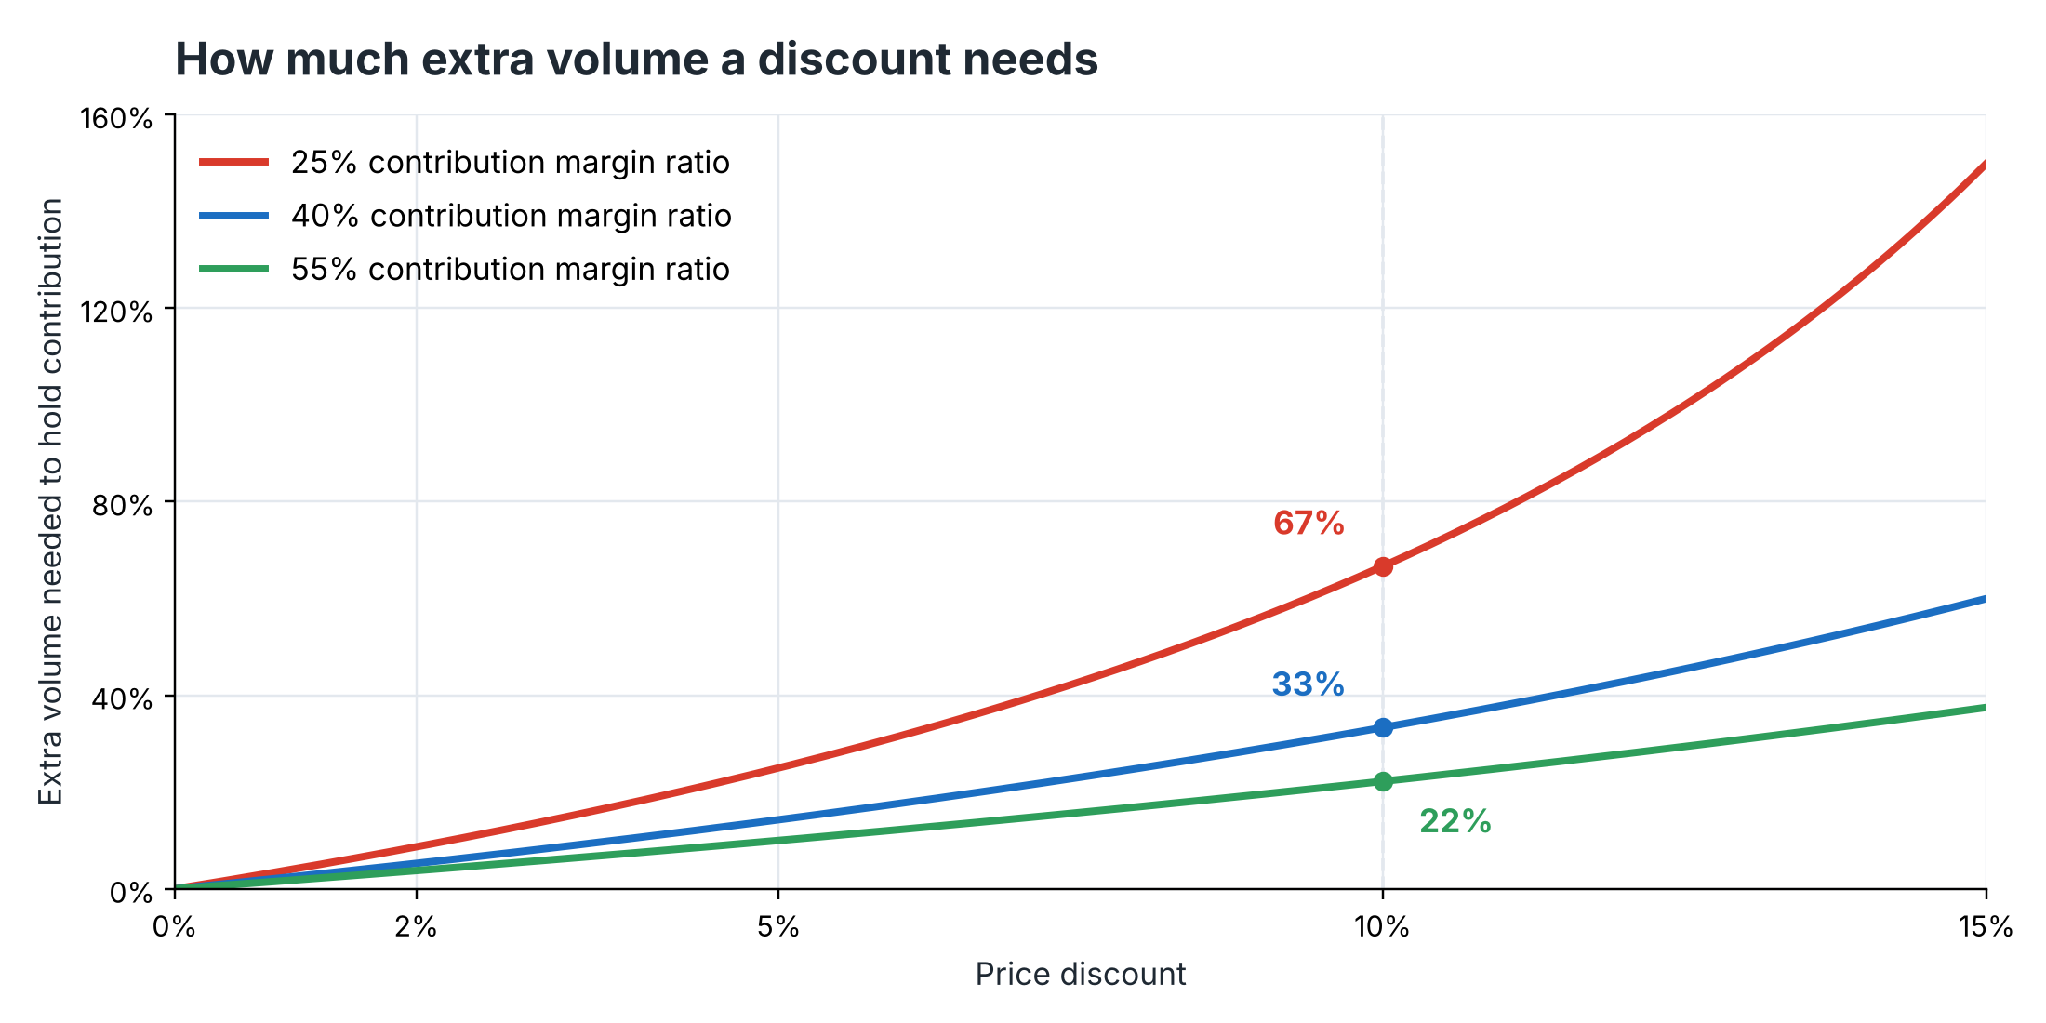
The table assumes variable cost per unit stays the same after the discount. Low-ratio products carry the steepest penalty, which is why a 10% concession on a 25% ratio product needs two-thirds more volume to break even.
Reps who see this table before negotiating tend to trade terms such as delivery windows ahead of price. The pattern behind discounting too aggressively usually starts with a missing view of exactly this math.
Deal approval floors
A floor set in contribution margin reflects the freight and commission each deal actually carries. Floors written in gross margin can approve a deal that looks healthy on product cost and then loses money once delivered pricing and rebates apply.
A clear pricing approval workflow can route any quote below a contribution floor to a deal desk while everything above it moves straight through.
Product mix under capacity limits
When a machine or a line runs at capacity, the useful measure becomes contribution margin per constrained hour. Product A earns $80 per unit and needs two machine hours, or $40 per hour, while Product B earns $45 per unit in half an hour, or $90 per hour.
Product B deserves the scarce capacity even though Product A earns more per unit. Ranking products by contribution per constrained hour keeps a fully booked plant from filling up with the wrong orders. The same logic applies to labor hours on a constrained assembly cell or trailer space on a fixed delivery route.
Customer-level contribution
Tiering the calculation also shows customer profitability. Companies define the tiers differently, so writing down what each tier includes matters more than the labels.
CM3 is where cost to serve enters the picture. An account with frequent small orders and expedited shipping can look strong at CM1 and break even at CM3.
Consider an account buying $1.5 million a year at a 38% CM1 ratio. If it places 140 small orders a month with next-day delivery, handling and shipping can pull CM3 close to zero, a pattern a minimum order size or an expedite charge usually corrects.
See contribution margin on every quote line
Vistaar shows net margin on each quote before it reaches the customer, so reps negotiate against the real number.
See deal-level margin visibility
Common Mistakes When Calculating Contribution Margin
Small classification errors compound across thousands of orders. Five mistakes account for a large share of misleading contribution figures:
- Starting from list price: Contribution calculated on list price overstates every deal that carries an on-invoice discount
- Counting rebates twice: Subtracting a rebate from revenue and again as a cost understates contribution on rebate-heavy accounts
- Using stale standard costs: A material cost set at budget time misses mid-year increases like the one modeled above
- Treating allocated overhead as variable: Spreading plant overhead per unit makes high-volume products look less profitable than they are
- Ignoring freight terms: Delivered and ex-works orders for the same product carry very different contribution
Each mistake moves the answer in a predictable direction, which makes them easy to test for. A quarterly check of ten large orders against their full cost detail catches the bulk of classification drift. Rebate-heavy accounts and delivered-price orders make the best starting sample.
Running the Same Order Through Vistaar
The spreadsheet calculator works one order at a time. Inside Vistaar, the same 500-unit order passes four checkpoints, and each one maps to a line in that calculator:
- Quote: The rep builds the order in Vistaar SmartQuote, which proposes Start-Target-Floor price bands for the customer and shows net margin as the discount moves from $0 toward $20 per unit
- Approval: A discount deep enough to push contribution below the floor follows the approval route set for that discount depth, and the deal desk receives the quote with its margin context attached
- Rebate: The 2% rebate line draws on Vistaar SmartRebates, where every qualifying transaction updates the accrual for that customer's program
- Review: After the order ships, the pricing dashboard places its contribution in a period waterfall next to every other order, split by price element and by customer
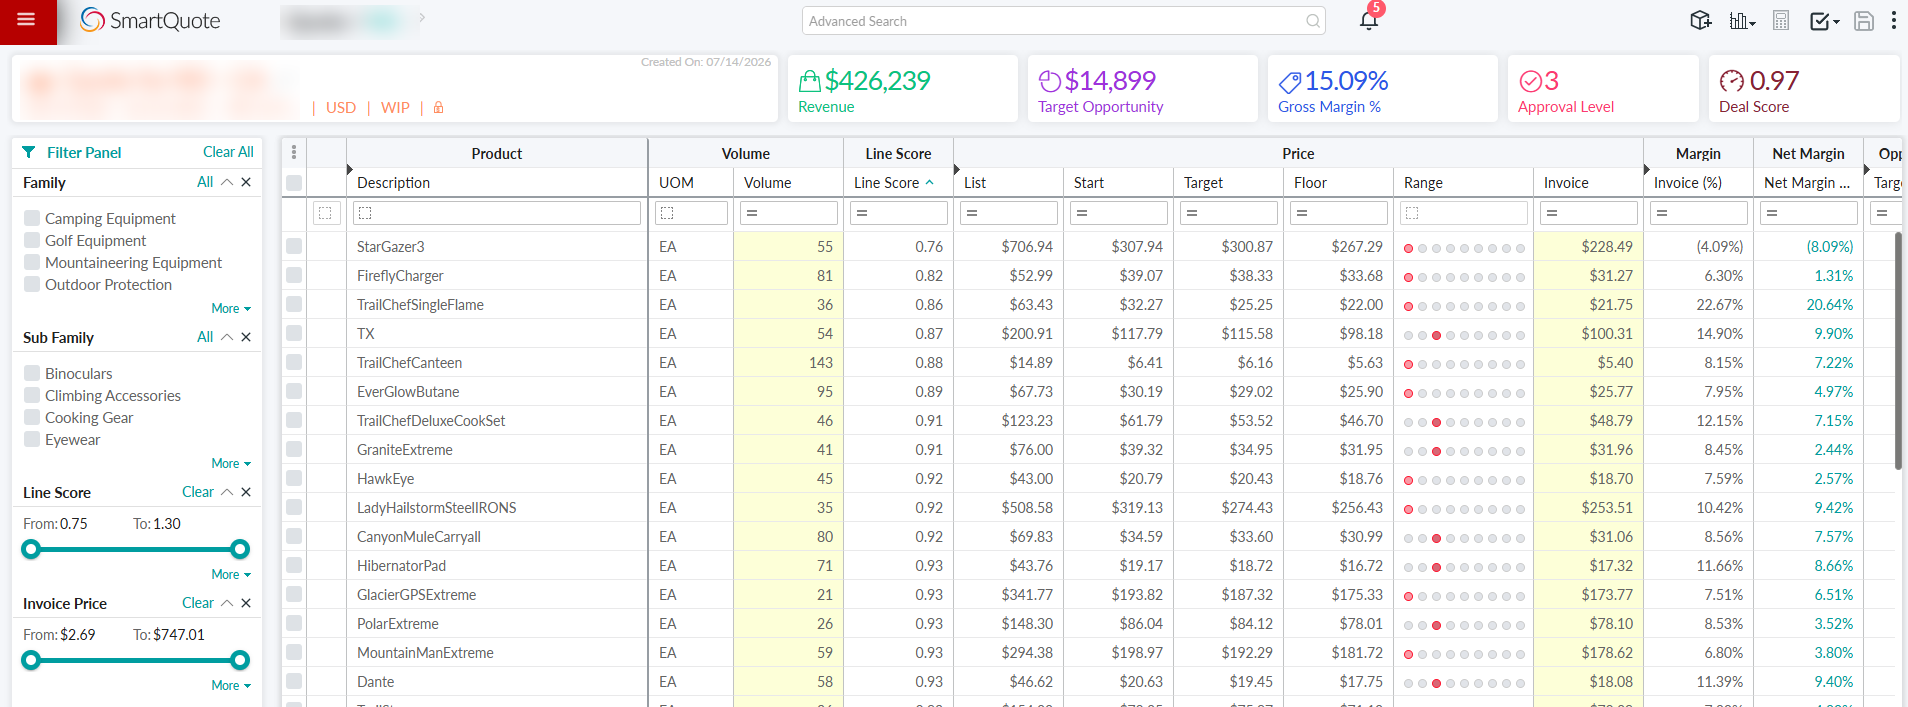
The materials increase modeled earlier fits the same flow. In Vistaar SmartPricing, the team can test the $205.62 and $209.71 price options against projected margin and revenue before either one reaches a customer.
Put Contribution Margin to Work in Your Next Pricing Decision
The formula is simple, and the room for error sits almost entirely in the inputs. Net revenue as the starting point, plus one consistent treatment for rebates, turns a textbook formula into a number a deal desk can trust.
A practical starting point is to run the worked calculator on your five largest open quotes. Compare each result with the gross margin the team quoted, then set a contribution floor by product family and apply it to the next pricing cycle. After two cycles, compare approved deals above and below the floor to see whether it sits at the right level.
Price every deal against contribution, before it closes
Talk to Vistaar about putting contribution floors and net margin into your quoting and approval workflow.
Request a demo
Frequently Asked Questions
These answers cover common questions about contribution margin calculations.
What is the difference between contribution margin and gross margin?
Gross margin subtracts cost of goods sold from revenue. The contribution version subtracts all variable costs, including freight and commissions, so it usually comes out lower and gives a clearer view of deal profitability.
Can contribution margin be negative?
Yes. A negative contribution margin means each additional unit sold adds to losses, because the price fails to cover variable costs. Products or deals in that position need a price change or a cost fix before more volume.
Is contribution margin a GAAP measure?
It sits outside GAAP reporting. Finance and pricing teams use it internally for decisions such as pricing and product mix.
What is a good contribution margin ratio?
Benchmarks vary widely by industry and business model. A useful internal test is whether the ratio covers fixed costs at expected volume with room for the discounts sales typically grants.
How do rebates affect contribution margin?
Rebates reduce contribution margin whether they are booked as a revenue reduction or a variable cost. The key is to record each rebate in one place only and to accrue it as qualifying sales occur.

As an experienced pricing solutions partner to some of the biggest names in global business, Vistaar offers a range of services to help our customers reach their maximum potential. Talk to us to see how we can help you create a more profitable future.