




Key Takeaways
- Margin analysis breaks profit margin down to the customer and transaction level to show what moved it
- Pocket margin, measured after rebates and freight, is the figure that matches what the business actually keeps
- A margin bridge in points separates price effects from cost and mix effects, provided the cost basis and customer set stay consistent
- A falling margin percentage can still be a sound outcome when gross profit dollars hold, so read both numbers together
- Analysis pays off only when each finding has an owner who can change a price rule or approval floor
Margin analysis is the practice of breaking profit margin down by customer and product, all the way to the individual transaction, to see what pushed it up or down. Finance teams usually run it at the company level on gross and net margin. Pricing teams need it one level deeper, where a single customer agreement or SKU can move the total.
The pressure to get this right has climbed in 2026. In the National Association of Manufacturers' second-quarter survey, 83.1% of manufacturers named rising raw material costs as their top business challenge, up from 57.5% one quarter earlier.
When costs move that fast, a company-level margin figure arrives too late and says too little. This guide covers how to run the analysis at a level pricing teams can act on, and how to read the results with healthy skepticism.
What Margin Analysis Covers in a B2B Business
A margin figure means something different at each level of the business. The useful question at every level is what the number answers and what it leaves out.
Reported figures usually stop at the segment level, while pricing decisions happen account by account and order by order. A useful margin analysis connects the two, so a change in the company figure can be traced to the accounts and SKUs behind it.
Which Margin to Analyze: Gross, Contribution, or Pocket
The level sets where you look, and the margin definition sets what you count. Choosing the wrong definition is the fastest way to produce a confident answer to the wrong question.
Gross margin is the number on the income statement, so leadership asks for it first. It often looks healthier than reality because rebates and freight sit outside the calculation.
For pricing work, pocket margin is the better default. It reflects what the business keeps after the full price waterfall, which is the figure a discount or rebate decision should be judged against.
How to Run a Margin Analysis, Step by Step
A repeatable analysis follows the same six steps every cycle. The order matters, since errors in the early steps carry into every later conclusion.
- Frame the question: Pick one decision the analysis should inform, such as next quarter's price increase or a review of a distributor program
- Build the transaction dataset: Pull invoice lines with customer and SKU detail, then attach the cost basis that applied when each order shipped
- Allocate off-invoice items: Assign rebates and freight back to each customer and product so every line carries its pocket margin
- Build a period-over-period bridge: Separate the price effect from cost and mix effects, with each expressed in points
- Cut by customer and SKU: Rank the accounts and items that contributed most to each effect
- Assign actions: Hand each finding to an owner who can change a price rule or a program term
Step three is where many analyses fall short, since rebate data often lives in a separate system. A price waterfall gives that allocation a structure, from list price down to pocket price, so every deduction lands somewhere visible.
Data quality decides whether those six steps hold up. Duplicate ship-to accounts can split one buyer into several records, and SKU substitutions can make a price increase look like a mix shift, so a short cleanup pass belongs before the first bridge.
A worked margin bridge
Consider an industrial distributor whose gross margin fell from 24.0% to 22.6% year over year. Leadership's first instinct is to blame the sales team for discounting, so the pricing team builds a bridge before anyone acts.
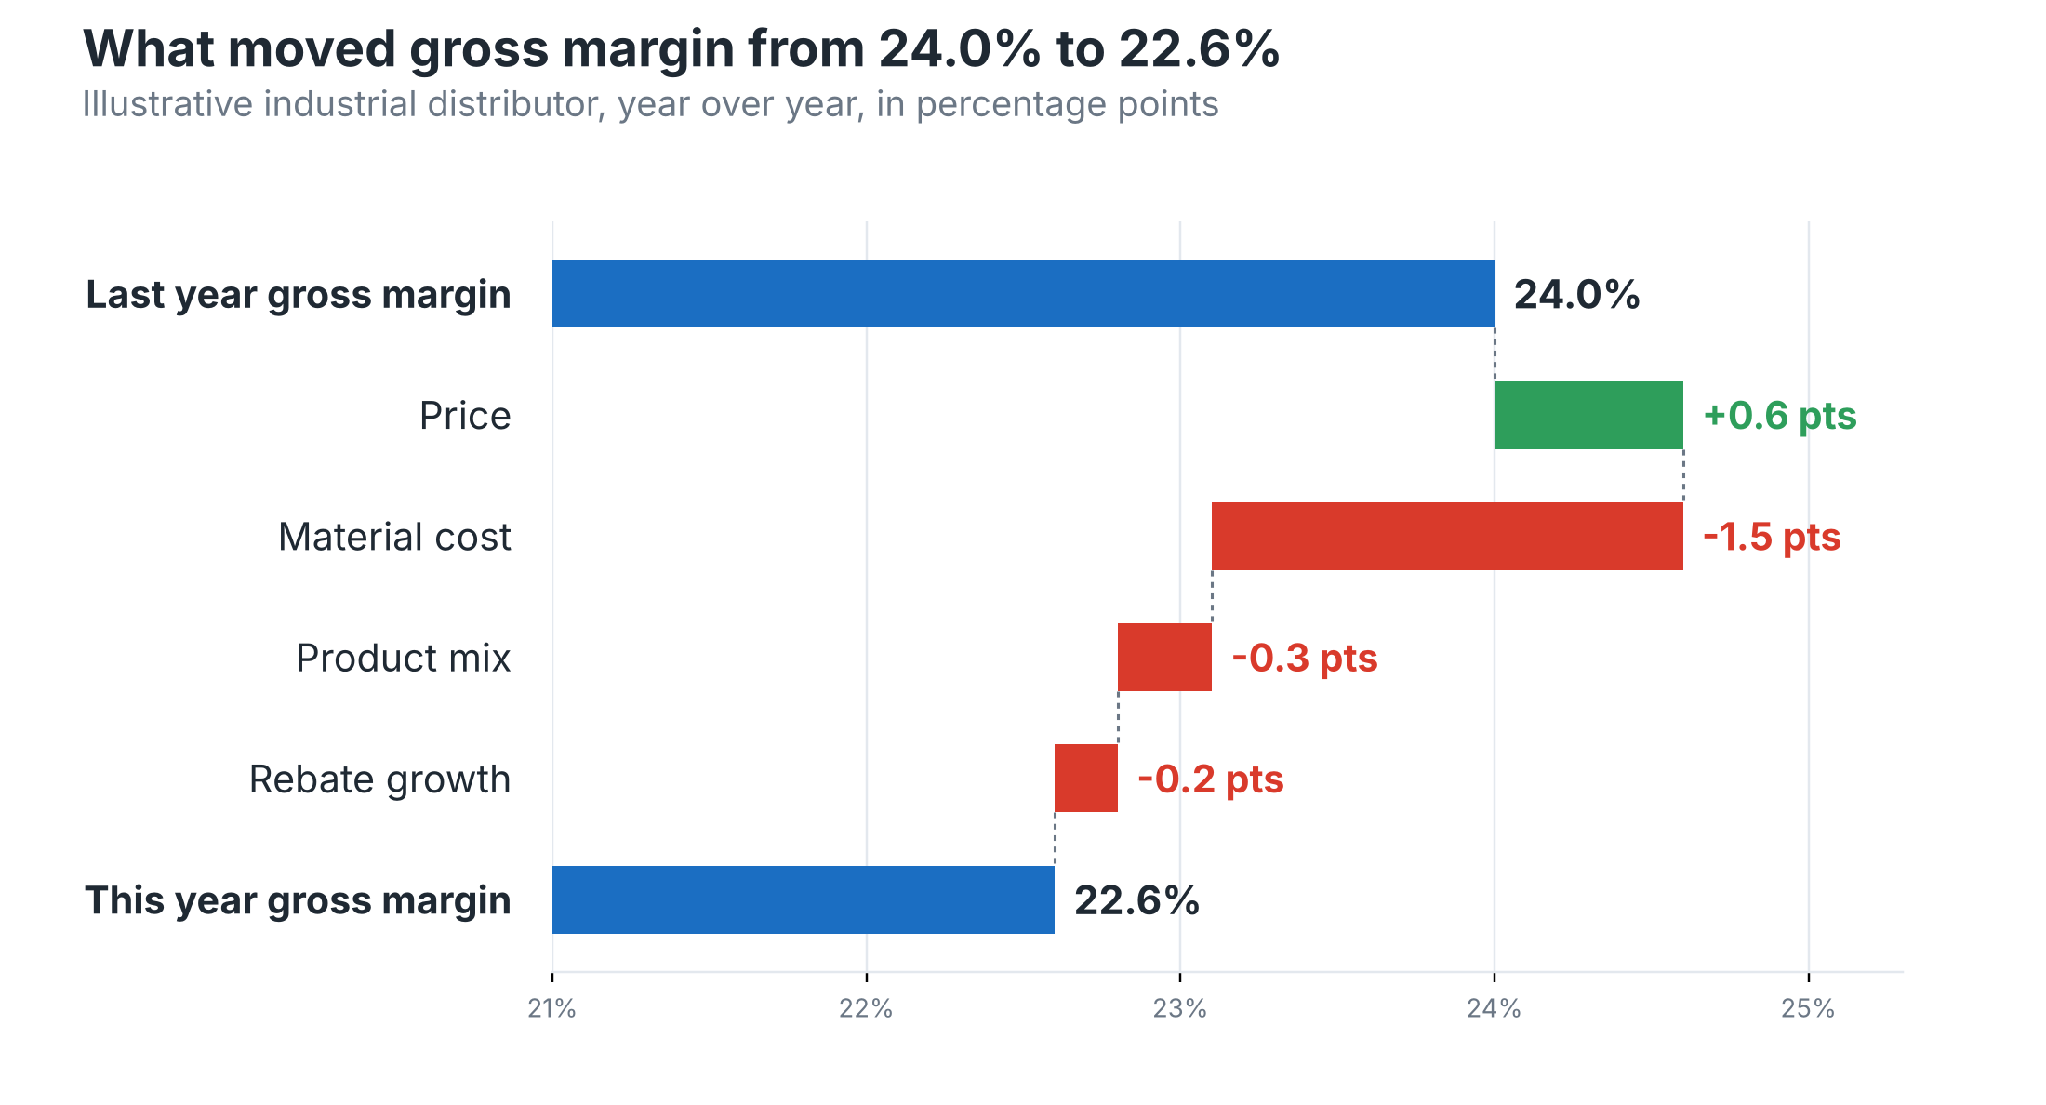
Each bar in the bridge then gets a cause and an owner, which turns the chart into a work list:
Read top to bottom, the bridge moves the conversation away from discounting. Material cost outweighs the other three drivers combined, and a cut by customer traced most of it to 40 accounts on annual fixed-price contracts without an index clause.
The response therefore belongs with cost pass-through and renewal terms. A price-volume-mix analysis applied the same way to revenue completes the picture.
Reading a Margin Bridge Without Fooling Yourself
Bridges look precise, and that precision invites overconfidence. Five habits keep the conclusions honest:
- Hold the customer set constant: Compare the same customers across both periods, since new and lost accounts otherwise show up as price or mix effects
- Use the cost that applied at shipment: A standard cost set in January understates June's real cost and makes price effects look stronger than they were
- Separate mix from price: Selling more premium SKUs lifts average price without any customer paying more, so mix needs its own bar
- Match rebate timing: Compare accruals with accruals, since mixing accrued and paid rebates moves margin between periods artificially
- Read dollars and percent together: A cost passed through in dollars keeps gross profit flat while the margin percentage falls
The last habit deserves a number. Suppose a product costs $80 and sells for $100 at a 20% margin. When cost rises to $88, passing the $8 through gives a $108 price with $20 of gross profit intact, while the margin percentage slips to 18.5%.
That lower percentage reflects a sound pricing decision. A bridge read in percentages alone would flag it as margin erosion, and the team could end up chasing a problem that sits only in the denominator.
Customer and Product Profitability: Where the Analysis Pays Off
Bridges explain change over time, while customer and product views explain where margin sits today. Pricing teams usually recover the most margin at this level.
A pocket price band plots the pocket price each customer pays for the same SKU. For example, a fastener distributor might find one SKU selling between $41 and $58 pocket price to customers of similar size and order frequency.
Wide bands point to inconsistent discounting, provided order size and service levels explain little of the spread. Customer profitability analysis then layers in what each account costs to serve.
Service cost changes the ranking more than teams expect. Small, expedited orders can turn a high-margin account into a marginal one once cost to serve sits next to pocket margin.
The SKU tail
Product-level analysis often turns up a long tail of slow movers. A packaging manufacturer with 12,000 active SKUs might find 3,000 of them shipped fewer than ten times last year, each order carrying setup and changeover costs that list price was never built to cover.
Tail SKUs usually deserve their own pricing logic, such as a setup charge or a minimum order quantity. Price band analysis shows which of them sell at prices well below comparable core items.
Margin Analysis When Costs Move
Cost volatility puts the most strain on margin analysis, because the cost basis itself keeps shifting. NAM survey respondents expect input costs to climb 5.8% over the next 12 months, up from a 4.1% expectation one quarter earlier.
Worth Knowing
NBER researchers estimate that 94% of the 2025 US tariffs passed through into the price of imports, which means importers absorbed most of that cost before setting their own prices.
Two practices keep the analysis reliable through cost swings. The first is refreshing the cost basis monthly, or weekly for commodity-linked items, so the bridge reflects the cost that applied when each order shipped.
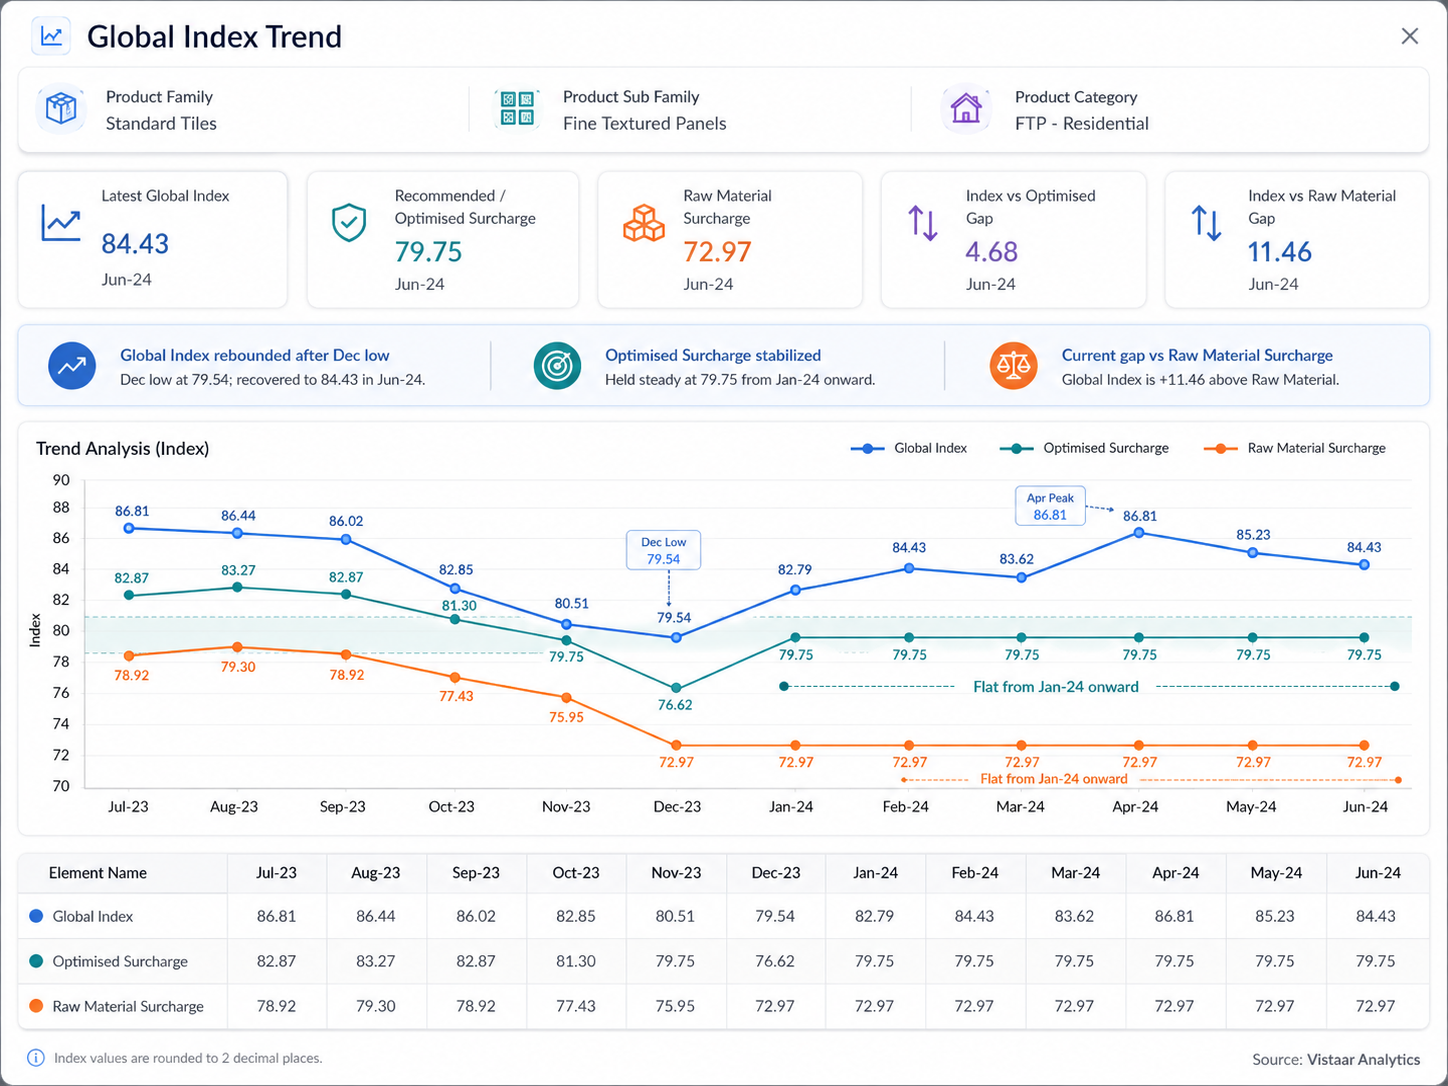
The second is tracking surcharges and index-linked prices against their underlying index. Products priced through raw material index pricing should show how far the surcharge trails the index, since that lag is where cost-driven margin loss starts.
From Analysis to Action
Analysis earns its keep once each finding reaches someone who can change a price rule. The handoff works best when each finding is written down next to its action and its owner.
Approval floors matter most here, since they turn a finding into a standing rule. A clear pricing approval workflow routes each below-floor quote to the right person without slowing every deal.
Rebate findings need the same discipline on the finance side. Teams that automate rebate accruals can see margin net of rebates while a deal is still open.
See margin before the quote goes out
Vistaar shows net margin on each quote line, so findings from margin analysis reach reps while deals are still in negotiation.
See deal-level margin visibility
Choosing Tools for Margin Analysis
The right tool depends on how often the analysis runs and how many people act on it. Each option below handles part of the job well.
Spreadsheets carry a hidden cost in the allocation step. Rebuilding rebate and freight allocations by hand each month takes days, and the analysis tends to arrive after the pricing decisions it was meant to inform.
BI tools solve the visibility problem and leave the action problem open. A dashboard can show a below-floor discount on hundreds of invoices, while changing the floor still happens somewhere else, often weeks later.
How Vistaar Supports Margin Analysis
Vistaar builds enterprise pricing and rebate software for B2B companies. Its products cover the analysis steps above and connect findings to the pricing workflow:
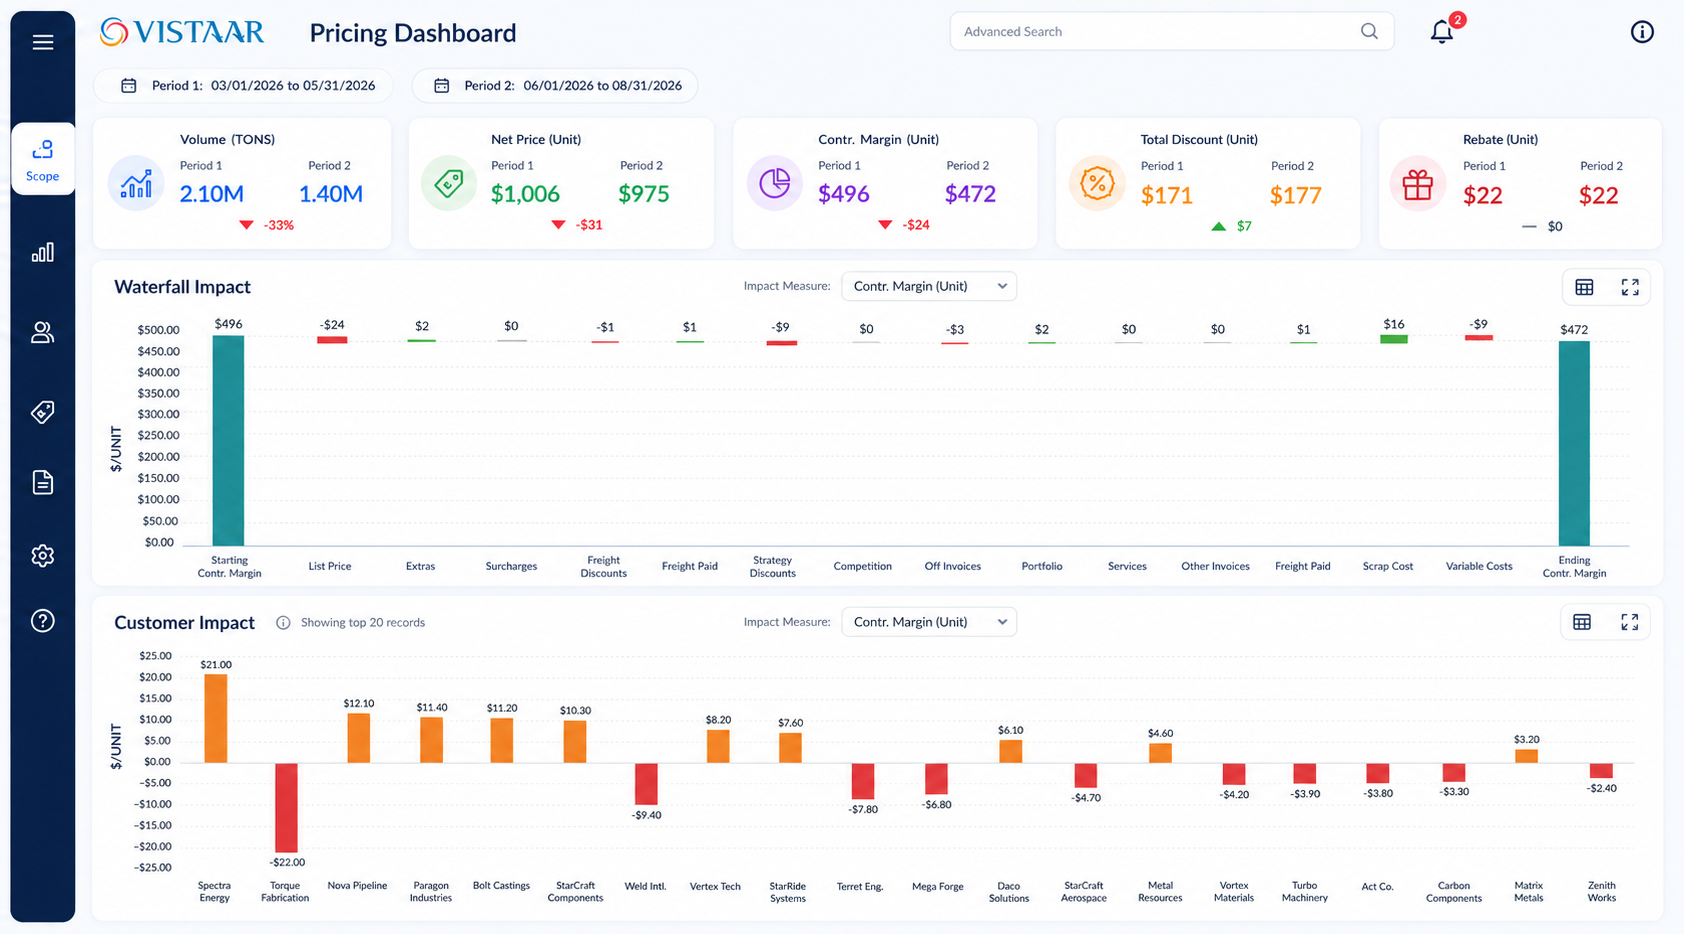
- Margin bridges: Vistaar's pricing dashboard breaks contribution margin down from list price through discounts and surcharges, by period and by customer
- Deal-level margin: Vistaar SmartQuote shows net margin on every quote alongside Start-Target-Floor price bands
- Leakage detection: Vistaar SmartPricing flags margin leakage and pricing anomalies, and models cost movements before new prices go live
- Rebate accruals: Vistaar SmartRebates updates accruals with every qualifying transaction and lets users drill from an accrued amount down to its transactions
- Segmentation: Vistaar SmartOptimizer groups customers by purchase behavior and simulates price strategies to compare their margin impact
Teams that want a structured method for the transaction-level work can follow this guide to finding margin leakage in their own data.
Vistaar was named a Leader in the inaugural 2026 Gartner Magic Quadrant for B2B Pricing and Rebate Optimization Software.
Make Margin Analysis a Monthly Habit
A monthly routine with fixed owners gets the most out of margin analysis. Quarterly reviews tend to confirm losses after the orders behind them have shipped.
Start with pocket margin for your top 50 customers and the SKUs that carry most of your volume. Build one bridge per month in points, then hand each finding to a named owner with a date attached. Keep the first bridges simple, with four or five bars, until the team trusts the numbers behind them.
Over two or three cycles, the conversation shifts from explaining last quarter to adjusting floors and programs before the next one. The margin impact of a pricing platform depends largely on how quickly those adjustments reach the invoice.
Turn margin analysis into pricing action
Talk to Vistaar about connecting margin bridges and pocket margin with your approval floors and rebate programs.
Request a demo
Frequently Asked Questions
These answers cover practical questions that come up once a margin analysis program is running.
How is margin analysis different from variance analysis?
Variance analysis compares actual results with a budget or forecast. The margin version explains what moved margin between two periods or across customers, which makes it the better tool for pricing decisions.
How often should B2B pricing teams run margin analysis?
Monthly works well for most B2B portfolios, with weekly checks on commodity-linked products during periods of cost volatility. Quarterly reviews usually surface losses after the affected orders have shipped.
What data does a transaction-level margin analysis need?
It needs invoice-level data broken out by customer and SKU, plus the cost in effect on each ship date. Off-invoice items such as rebates and freight should also be allocated back to each line.
Can margin percentage fall while profit improves?
Yes. Passing a cost increase through in dollars holds gross profit dollars steady while the margin percentage declines, and higher volume at a slightly lower margin can raise total gross profit.
Which margin should a deal approval use?
Contribution or pocket margin works best for approvals, since both include the freight and rebates a specific deal carries. Gross margin suits reporting better than deal decisions.

As an experienced pricing solutions partner to some of the biggest names in global business, Vistaar offers a range of services to help our customers reach their maximum potential. Talk to us to see how we can help you create a more profitable future.